Development of a Symbol System for Disaster Management
Spatial information plays a key role in disaster management. Upon occurrence of an emergency situation, crisis management actors need specialised maps to give them a clear idea of the emergency, localisation, distribution and characteristics. Effective representation of spatial information can be achieved by means of graphical symbols. Silvia Marinova describes how a symbol system should be associative and quickly perceived by map users even without the use of a legend, especially in an emergency.
A number of agencies and organisations related to disaster protection develop databases, geo-portals and cartographic products for crisis management and their own standards for symbols. In Bulgaria as well as in other countries there is no standard symbol system for disaster management. Such general standardisation could be done through: object classification, colours, symbol type and graphical variables. Taking into account the advantages and disadvantages of existing emergency symbol systems, a new symbol system for the needs of Disaster Management was developed at the Laboratory on Cartography, University of Architecture, Civil Engineering and Geodesy, Sofia.
The Symbol System for Disaster Management (SSDM) was developed to support thematic mapping for early warning and crisis management and operational work of all participants in the unified rescue system, regional and municipal authorities, as well as to help citizens understand specialised maps of emergency situations. The symbol system is designed not only for professionals but also the general public.
Classification Structure
The SSDM consists of a 4-level hierarchical classification of objects and phenomena concerning disaster protection and a set of 115 symbols. At the highest level, all objects are divided into 5 categories: Disasters; Infrastructure; Protection Services and Safety Infrastructure; Affected People and Infrastructure; Operational Sites and Activities. Each category is divided into classes, and they in turn are divided into subclasses, which consists of objects and phenomena.
Design of Symbols
Design of the SSDM started with studying theoretical foundations of cartographic semiotics, considering the rules of construction and use of symbol systems, examining relations between objects and phenomena, their classification and specifics. The ability of symbols to transmit information as well as the way they can be perceived by map users are of great importance. The design process was accompanied by optimal requirements to achieve readability, expressiveness and visibility, taking into account modern technologies and techniques in cartography.
One of the main challenges in developing disaster protection maps is the choice of appropriate graphical variables in order for all the symbols to be quickly and easily perceived, to be associative and to be properly referred to their respective categories.
All categories of SSDM are distinguishable by their shape and colour. The symbols consist of pictograms in white colour and shapes with a particular coloured background. The pictograms have uncomplicated but not too simple designs as symbols should be associative and give information about concrete objects and phenomena. Similar elements in different symbols have equal width, length and the same general design. For each category a different shape is chosen as well as a different background colour to support rapid association of the symbols to the appropriate categories. The choice of colours, except to achieve clear distinctiveness, also depends on the message that symbols should express to the users. There is also a psychological perception of the colours that has been taken into account. Colour specifications are expressed in RGB and CMYK values to achieve colour standardisation. Different shapes for all categories aim to avoid potential problems due to low light or black and white printing.
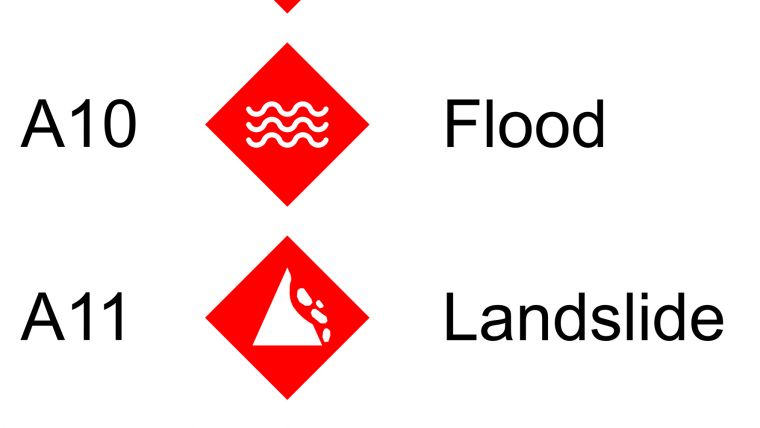
For easy identification, each category has an individual letter code (A for Disasters; B for Infrastructure; C for Protection Services and Safety Infrastructure; D for Affected People and Infrastructure; E for Operational Sites and Activities). Each object and its respective symbol also gets an alphanumeric code formed by the category code and serial number of the object in its category.
Figures 1, 2, 3, 4, 5, present part of the symbol system including an alphanumeric code, a graphic symbol and a brief description.
Presenting Affected Infrastructure in Crisis Situations
The status of “Infrastructure” and “Protection Services and Safety Infrastructure” objects in crisis situations is performed by a combination of symbols of category B (Infrastructure) and C (Protection Services and Safety Infrastructure) with symbols presenting destroyed, affected and unaffected objects of category D. In this combination, the symbols of Category D have reduced size and they are located in the upper right corner of the symbols of categories B and C (Figure 6).
Mapping for Disaster Protection
The SSDM is applied in the experimental development of a series of maps for disaster protection at local and regional levels and designs for training maps supporting actions in emergencies. The main tasks of local and regional disaster protection plans are analysis and assessment of disaster risks, prevention and mitigation, early warning, coordinating activities, etc. Depending on the role of participants in these activities, they need specialised geographic information to support their actions.
For the needs of activities described in the disaster protection plan of Troyan municipality, base maps of the municipality in scale 1:50 000 and the town of Troyan in scale 1:10 000 (Figure 7) were produced. They are compiled according to predefined elements of map content using the new map Symbol System for Disaster Management. The symbols of SSDM support the main features of hydrography; relief; settlements; infrastructure (including transport, telecommunication, energy, manufacturing and water infrastructure); administrative boundaries, as well as services and facilities (such as hospitals, shelters, helicopter pads, etc.) related to disaster protection. The base maps are used for the creation of a series of maps for disaster management in case of earthquakes, floods, fires or industrial accidents as a part of the specialised plans for disaster protection in the municipality. Additional information is provided for some features including object name and description, number of beds in shelters, dangerous industrial objects, type of stored materials, fire-fighting equipment, etc. Infrastructure and services/facilities for protection are represented by the symbols of Category B and C. All these maps support pre-disaster activities including assessment and preparedness. In crisis situations, these maps can be processed into reference maps presenting type and location of the disaster/s through adding symbols of Category A and symbols for affected people and affected infrastructure of Category D. By adding information about operational sites and activities, (Category E) decision-makers can get maps for disaster response. In the post-disaster phase, the symbol system could support damage assessment and recovery.
Map content and displayed information of operational situations aim to support authorities and individuals in making quick and effective decisions. Maps allow identification of affected areas and give significant contributions to population protection, mitigation and planning evacuation operations.
Cartography plays a key role in all the main stages of disaster management. The efficient and cooperative preventive and protective activities of authorities require appropriate and easy to understand geographic information. The use of standard system of associative symbols can facilitate significantly in cooperative disaster management strategy at local, regional and international level.
This article was published in GIS Professional October 2017
Acknowledgements
Thanks to Prof. Dr. Temenoujka Bandrova, head of Laboratory on Cartography, University of Architecture, Civil Engineering and Geodesy, Sofia for supervising the thesis on thematic mapping and visualisation for early warning and crisis management and to City Government of Troyan and KartGeo Ltd. for providing data.

Value staying current with geomatics?
Stay on the map with our expertly curated newsletters.
We provide educational insights, industry updates, and inspiring stories to help you learn, grow, and reach your full potential in your field. Don't miss out - subscribe today and ensure you're always informed, educated, and inspired.
Choose your newsletter(s)