Geo-referencing and Visualising Retail Store Stock with Geospatial Technologies
When the Internet first became available to staff at the University of Aberdeen, we were soon approached by a small Internet provider in Aberdeen (Internet for Business (IFB)) to look into the concept of developing a more visually interactive experience for online shoppers than the standard list-type shop-front that existed then on the Web. The idea was to use early digital Ordnance Survey (OS) map data as an interface to allow shoppers to navigate street maps – as if walking along a street – to a shop-front – and then ‘walking’ into a higher resolution digital plan of the store to search for items.
At the time, the technology to do this was not quite ready. Today, by contrast, geospatial and Internet technologies have advanced so much that it is now possible to develop such an interface using low-cost, off-the-shelf software. In this article, we outline the possibility of achieving this goal with some of the widely and freely available software as a means to better manage store stock for customer display.
In the retail sector, businesses strive to understand the decision-making processes and spending habits of consumers in order to improve product sales. Data is continually being generated from consumer activities and purchasing behaviour. Intelligent Business Information Systems (BIS) are well-established within the sector, providing management tools for tracking and analysing sales performance that can be utilised to inform the development of future sales and logistical strategies, though these systems are quite limited in their ability to record and process spatial data.
GIS in the Retail Sector
The use of GIS to date has generally been restricted to applications outside the store environment, such as determining the optimum site location for a store based on customer demographics. ‘In-store’ applications have, however, been few, and although there are benefits from using GIS technology, they have not yet been widely embraced by the retail sector, especially in relation to their potential in-store management.
Within retail stores, new seasonal items are continually being introduced to the shelves to create a dynamic store environment when updating the display of merchandise. To date, there appears to be no evidence of a visual merchandise location tool for managers to refer to when trying to help explain sales performance of goods. This study demonstrates the development of a simple spatial information system for geocoding display areas, providing the basis for locating stock, and helping to quantify the effects of visual merchandising on purchasing behaviour. The system proposed here also provides the basis to track sales performance to help provide an input to operational decision-making. GIS provides tools to track goods at the shop-floor level and to develop an understanding of how areas within the stores are performing, not only in relation to sales, but also employee performance. For example, it may be the case that staff perform more successfully in particular zones of a store that they are responsible for, or in areas that they favour, providing useful information for managers when assigning operational tasks.
The Operational Store Environment
The research outlined is based on a small retail store. The vendor sells luxury fashion products and is part of a large international fashion retailer chain. The sales area of the store is approximately 155 square metres and the stock room covers an area of approximately 65 square metres. The other stores within this retail chain all have a similar operational environment, and therefore the methodology proposed could be applied throughout the chain.
The store environment is dynamic, with products being replaced by ‘new-season’ collections; new colours and clothing styles are introduced throughout the year. A strategy exists in which clothing lines are displayed using the colour palette for the season in particular ‘zones’ of the store. This is highlighted in Figure 1, which shows the same area within the store with different colour palette displays.
Goods delivered to the store from the supply chain are held within the stockroom in designated areas until they are moved onto the shop floor for display. Goods that are out of season, or required by other stores within the retail chain are also kept in the stockroom until they are transferred out of the store. On the shop floor, items are displayed in a particular visual manner or ‘architecture’, which is deemed to be visually appealing by the visual merchandising department. Guidance for display configurations is provided by head office, but as different stores within the chain may be configured differently, variations in these displays are inevitable; the model display, therefore, is merely a guide, although a set number of items are required within the displays.
The display of items is also linked to sales figures, with poorly performing items given more prominence within the store. Furthermore, different stores within the chain have differing seasonal product colours and stock-levels, which change depending on the sale of items, requiring the configuration of items be changed to match a given ratio of sale to full-price floor space (Figure 2).
Sometimes Items within the back stockroom never make it out onto the shop floor. This can lead to inaccurate perceptions as to the saleability of the product, and may therefore be removed from a store and shipped elsewhere. Such decisions are currently usually made based on incomplete information. The essential point to consider is that stock continually enters and leaves the store, and items are moved around within the shop floor, and is dependent on the operational requirements.
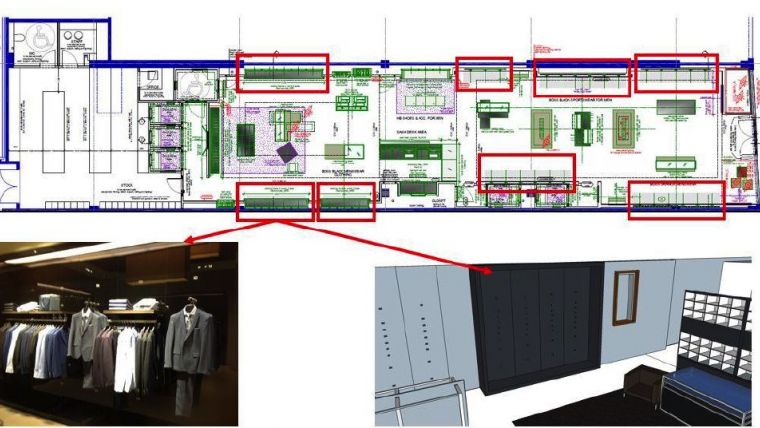
There are exact standards or ‘architecture’ for displaying products within the store, which are consistent for all stores throughout the retail chain, regardless of the item category or colour being displayed. The store is divided into designated zones, depending on the product category. Items are sub-divided further and displayed in sections or ‘bays’, which are defined spaces for displaying a category of merchandise, for example, sports category or formal category (Figure 3). Within the ‘bays’, items are displayed on hanging rails, folded on shelving, or placed on display tables. Folded items are displayed in columns of four, and fifteen items are hung per hanging bar in groups of three. An exact number of hangers must be on a T-bar rail (15), and an exact number of items must be placed on a shelf in a specified number of columns (Figure 4). This configuration is standard across all of the stores within the wider retail chain, regardless of whether the items differ in style and colour from store to store.
The product display system is based on a modular system, which can be adapted to the operational requirements. Shelving, rails and display tables are moved to adapt to visual merchandising requirements that showcase seasonal stock. Small recesses in the wall of the store are connection points for display components; the components are shelving and hanging rails, which are known as ‘T-brackets’ (Figure 5). The connection points are evenly spaced within the bays, into which the hanging brackets and shelves clip. There are, therefore, multiple connection points within a bay that offer the ability to display items in a variety of configurations. The ability to create an in-store location address for products is therefore possible due to the design layout process that every shop in the retail chain must comply with.
The Problem
The store used here as an example to illustrate the use of geospatial technologies holds, on average, three to four thousand items of stock at any one time. However, there is currently no record of whether an item is held in the stockroom or in the sales area. There is also no method of using or recording spatial data, and no methods for storing and retrieving information about the historical location of goods in the store. There is also no understanding of the effects past visual merchandising techniques have on sales of merchandise. Currently, only the number of items sold and the type of items sold are recorded in purchase transactions. There is no record or history of where an item was placed and any relationship between the location of goods and sales performance is not quantified.
Visual display and item location decisions are made by managers who rely on previous experience, with knowledge that is mostly anecdotal. Problems arise when managers fail to emulate previous sales targets and are required to justify their results and actions to more senior managers. For example, items of stock not selling as well as in previous years require an explanation so that decisions can be made to help improve sales. Higher levels of sales of an item from previous years may be down to the previous manager at the time placing the item in a prominent position within the store (the item being displayed on a mannequin for example). This information would not be available to a current manager who would need to explain why the sale of the item is not performing as previously.
Currently, there are no visualisation tools in use to display, transmit and communicate pertinent ideas and information to the required audience that can lead to a lack of crucial information being communicated, as well as having the potential for miscommunication.
The Data
The store data used was sourced from sales figures and staff performance indicators taken from the store database. This included data that indicated product type, product colour, product price, past sales figures, and customer purchasing history.
A standard digital camera was used to take photographs as the basis to develop a 3D point cloud model of the store. Pix4D software was used to develop the model, and ESRI’s ArcScene programme was used for viewing the resulting model.
Physical measurements of the store and display components were also completed using a standard tape measure and a rangefinder.
A floor plan of the project area – to scale - was sourced (Figure 6). The schematic provided the starting point on which to build a CAD model, providing the horizontal dimensions of the floor space and acting as a base template for the construction of a 3D (Google) SketchUp model (Figure 7). Interior dimensions of the study area were measured and included vertical measurements of storage and shelf spacing, including tables, drawers, fixtures and furnishings. The spacings between clipping components were also measured and provided the foundation for geo-referencing of the display units. This information was used to create a 3D visual model in a CAD file format with a ‘.dae’ file extension. The model was integrated with VR technology so that it could be viewed through a VR headset. This was undertaken by downloading a plugin specifically designed for viewing 3D SketchUp models and then loading the application onto a smartphone.
The SketchUp model was also converted to be compatible with ArcGIS for viewing in ArcScene and was converted from a Collada file (CAD format) into an ArcGIS-readable file format with a .skp file extension to be used in Esri’s ArcMap, and viewable in ArcScene. The conversion was performed using ArcMap tools. A point cloud model of the project area was developed using photogrammetric tools and techniques. A number of high-quality images were taken that covered the project area with a 70% overlap of the images (with reference points). Using the Pix4D software the images were processed and stitched into a mosaic that was viewed as a point cloud. With the underlying architecture in mind, each component into which the shelving and hanging brackets is clipped was geo-referenced. This gave the area in which stock is stored or displayed a unique address or a geo-location. All bays and connection points were given an identification number matched to XYZ coordinates where each clipping point was geo-referenced within in-store the spatial system. This was also undertaken in ArcMap by creating point shapefiles for each clipping point. The shapefile attribute tables contained information on the item displayed at that location i.e. xyz coordinates; the date; number of sales of the item; and whether folded on a shelf or hanging on a bracket component.
The Benefits
This high-resolution spatial model created has the potential to benefit retail shop managers in a number of different ways:
- By providing them with an approach to derive information from in-store sales to aid in decision-making regarding day-to-day store sales operations, and especially to help gauge the success of visual merchandising.
- Providing a novel means of spatial record keeping for a retail store, and offer quantitative support for what is otherwise anecdotal knowledge and experience-based information.
- The addition of spatial location within a store also provides a quantitative basis for deciding where best to place items in the store and also to provide a basis for comparisons between stores to be made, another aspect that is useful for the area manager. This approach would also provide more useful data and information about customer purchasing behaviour within a store.
- The spatial referencing system developed for the project area provides a solid foundation for recording merchandise placement and generating historical data that may be used for analyses. Determining the relationship between location of products (in-store) through visual merchandising and product sales could be conducted through spatial analyses i.e. determining whether there are hot-spots and cold-spots within a shop, regardless of the item on display. This would require that the location of merchandise items be known in-store, and matched to number of items sold from the location. This would now be possible using the reference system generated in this project.
- This new system of tracking items in-store would provide management with an accurate ratio of goods on display to goods in storage. In addition, staff members not familiar with the stockroom layout would be able to find goods much faster. The area manager oversees more than a dozen stores in the area, and the sales data must therefore be accessed at least daily.
- By monitoring the time taken by management to access and interpret data, and the time taken by using a visualisation system, the time savings can be calculated and value added can be quantified in terms of time. Similarly, because product items will have a known location, tracking the item in store is possible (this is currently not the case); this information will save time when the products have to be gathered for shipment out of the store. Visualisation can help to improve these processes through time-savings.
Future Developments
Some further developments are envisaged. Incorporating data from all stores within the retail chain would be useful as well as conducting a comprehensive analysis of consumer purchasing behaviour with regard to ‘in-store’ place. Sales data from the BIS could also be collected daily to provide details of the type of item sold, time of sale, and the sales staff responsible. With this data, it would also be possible to determine whether sales staff perform better in some zones than others. Such information would add an extra dimension to Key Performance Indicators (KPIs) as a staff metric, providing the management with information for training schedules and targeted improvement agendas.
This article was published in GIS Professional December 2017
Value staying current with geomatics?
Stay on the map with our expertly curated newsletters.
We provide educational insights, industry updates, and inspiring stories to help you learn, grow, and reach your full potential in your field. Don't miss out - subscribe today and ensure you're always informed, educated, and inspired.
Choose your newsletter(s)