How to Increase Retail Sales Bridging IoT, Geospatial and AI
In the modern world, brick-and-mortar retail stores have to focus on new technologies to improve user experience (UX) and compete with the e-commerce stores. Geospatial analytics of location characteristics, demographic data, and trade areas helps retailers understand the impact this data has on store sales so that they can moderate success rates and improve performance. Internet of Things (IoT) also provides businesses with the ability to analyze the in-store impact light and temperature level has on consumer buying behaviour.
However, defining true buying behaviour patterns can only be accomplished by using artificial intelligence (AI) algorithms that combine IoT data with the data gathered from Geospatial Analytics. When AI is used in this way, it is possible to generate actionable insights that guide the way for positive changes so that greater success can be accomplished in the future.
Geospatial Analytics, also known as location analytics, identifies patterns in geospatial data in order to solve different problems in retail. With these analytics, a retailer can analyse where key customers leave, or where there is a better key customer density, a higher number of amplifiers, and less competition. After gaining all of these data points, it is much easier to choose the most suitable location for a new store, to predict sales for this location, and to define the reason for low sales in one store from a chain of others.
Nowadays, the use of Internet of Things (IoT) is widespread in our society and has various uses. It connects sensors, electronics, and devices together [1] and gives retailers the ability to keep constant temperature in refrigerators, to track the length of queues, or to save energy through smart lighting. In truth, the possibilities are vast, and businesses are now realizing that many valuable, actionable insights can be drawn from these devices to improve performance, customer experience, and business growth. In one report, it was claimed that by 2025, the Internet of Things applications could have US$11 trillion impact including retail environments with US$410B to US$1.2T [2].
So, in order to properly analyse data from IoT sensors and create actionable insights, it is necessary to utilize machine learning algorithms. To be clear, Machine Learning (ML) is a part of AI that includes learning algorithm (machines that can process information at speeds that no human could ever match).
“Subsequently, retailing and wholesaling, which are known for their high proportion of human work and at the same time low-profit margins, can be regarded as a natural fit for the application of AI and ML tools.” [3].
Smart Store Environment
If there is one thing that research has shown us, it’s that consumer behaviour changes faster than the wind. Aside from personal preferences, set marketing campaigns, and purchasing power, the behaviour of a customer is also heavily influenced by what type of mood they are in at any given moment. Look at it this way: happy people dawdle and browse, angry people don’t. Angry people just want to get things over and done with as quickly as possible, and anything that prevents them from doing so is just going to make them even angrier.
For retail, this is a very complex subject and requires careful planning. However, by utilizing leading IoT providers, one is able to develop a new type of smart store environment that can help make the customer’s mood become more positive and, as a result, can increase main retail KPIs and metrics. To do this, geospatial data like customers region of living, trade area characteristics and lifestyle of people for this area are analysed. Once that information is stored and analyzed, it can be compared with all parameters across the brand in different locations to get to statistical significance on how the brand's particular customer profile gets affected by the environment.
By gathering these valuable metrics, retailers have the ability to gain a deeper understanding of what their customers expect, and they can use the insights they gain to make actionable changes in different parts of the store. By doing this, it is possible to match the mood type of individual customers and increase the likelihood of sales by giving the correct type of temperature and light to specific types of products based on what data taken from IoT has shown.
Thermal Comfort and Buying Behaviour
“Actual in-store air temperature is a component of a more complex concept of human thermal comfort. Thermal comfort expresses human satisfaction with the thermal environment (CEN, 2005).”
Though often overlooked in many retail stores, thermal comfort plays a huge role in influencing a customer’s mood, and ultimately their buying decisions.
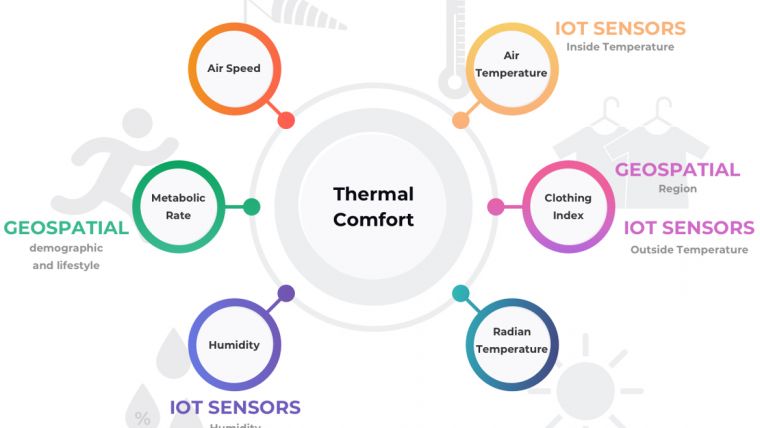
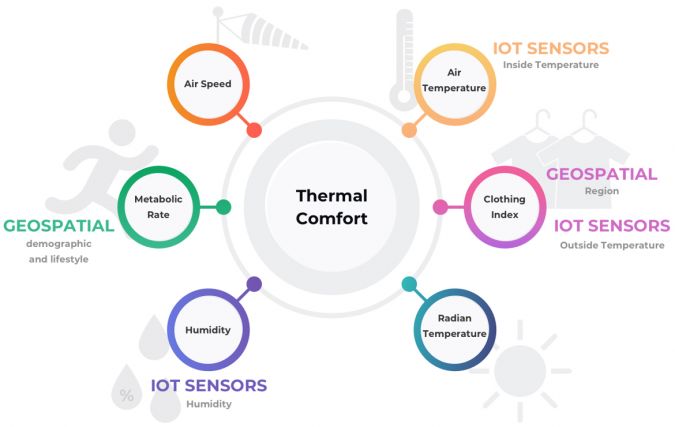
So, what steps are needed to attain thermal comfort in store? Well, it depends on six parameters, each of which are influenced by its sensation. It is the in-store air temperature, the relative humidity in a room or a store, the median radiant temperature, the air velocity (the movement of air), metabolic rates (activity of person), and clothing insulation levels or clothing index. Much like life itself, each individual customer experiences these sensations in a slightly different way based on his or her age, physiology, state and region of living [4].
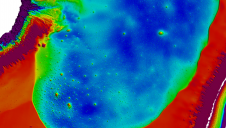
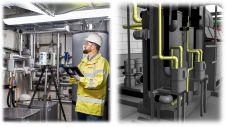
Thermal comfort, then, is a complex set of metrics that is generally hard for people to analyze. However, it is now possible to bridge data from IoT sensors (like in-store air temperature, humidity, outdoor air temperature) and geospatial data (including demographics characteristics of consumers, lifestyle data for metabolic rate definition and region of living for evaluating clothing insulation level) (Figure 1) for predicting consumer demand and how a retailer can influence it by changing the environment.
Even if a retailer has similar stores with the same size, the same year of opening, the same store design, and the same trade area characteristics in let's say Michigan and in Texas, he or she wouldn’t be able to compare sales and shopping behaviour among these stores even with the same inside temperature (71.6 F) as customers in Michigan and Texas have different thermal preferences. Moreover, if the outside temperature is different, they would have a different closing insulation level.
People have different thermal preferences depending on whether the region of their living is warm or cold [EN ISO 7730 (ISO, 2005)]. If people feel thermal discomfort, it affects their behaviour in terms of concentration, attentiveness and non-vigilance, tiredness, restlessness and irritation [5].
When measuring thermal comfort there are two metrics: one is for the amount of time spent inside the store, or near a particular department, and the other is the average number of items in the basket that is related to the amount of time spent.
For example, if the outdoor temperature is high and the customer is wearing only a t-shirt, the chance of them staying inside the store when the temperature is uncomfortably low is highly unlikely. Likewise, even if a retailer maintains a comfortable in-store temperature that is appropriate for people from that region or trade area, certain sections of the store, let's say a Dairy department, are significantly lower than the average in-store temperature. As a result, consumers are less likely to stay in those colder departments for longer than it is necessary to grab one bottle of milk, because of the low clothing insulation level and the low temperature in this department.
In addition, differences between outside and inside temperatures can have different effects on sales for different groups of products. For example, if the weather is hot outside and a person enters the store with the intention of buying a cold carbonated drink (i.e. Coca-Cola), if the temperature inside the store is uncomfortably cold when they enter, their decision is likely to change based as a result of that new sensation. This way, when the body temperature drops suddenly, the desire to drink a bottle of cold Coca-Cola to cool down drops with it and, as a result, the store loses a sale.
Considering this, the best way to define a human behaviour pattern and its dependencies on the human comfort is by bridging IoT sensors data, geospatial data, and using machine learning algorithms for analyzing the data and making actionable insights based on that analysis. Once this information is recorded, results of analytics can be used to help tune in-store parameters in real-time as external environmental factors like the weather outside keep changing.
Lighting and Consumers Buying Behavior
Along with the temperature, lighting also plays an important role in influencing the buying decision of the customer in store. Research has shown that consumers tend to stay longer browsing in different departments if those departments are adequately lit. As with thermal comfort levels, lighting level preferences and success rates differ throughout the store depending on what products they are being used on. Lighting, then, is an important factor that influences consumer buying behaviour: everything from the time they spend looking at goods on shelves, to the time it takes for the customer to pick up a product and place it in their basket.
However, as well as being able to influence consumer buying decisions, there also has to be a balance between efficient lighting for increasing sales and efficient energy consumption. After all, there’s no point making money by adjusting light levels to influence customer behaviour if you’re just going to lose all of those profits in energy costs. The best strategy in this case, then, would be to use IoT and AI together to find a lighting solution that not only improves buyer behaviour but provides valuable insights on how to distribute that lighting across the store in a way that keeps energy costs as low as possible.
Still unsure of how this works? Let’s consider another example: a chain grocery store operator would like to know the best light level for influencing sales in the Fresh Produce department. In this case, there are two possible scenarios. Ultimately, adjusting in-store lighting levels (within an acceptable range) either has a significant effect on sales or it doesn’t. If it does - the retailer can set the lighting to the level that was proven to be the most profitable for that particular store. If it doesn’t - the retailer can save on the energy bill by lowering the lighting level to lowest point in the acceptable range since that wouldn’t influence sales. Either way, the information gained from the process is equally valuable.
But how do businesses access this information? One effective method is to change the light level for one store for a period of perhaps one week or one month then analyze sales data taken during that time using state-of-the-art AI. After this, those results can then be compared with sales data for similar periods in the previous year, taking into consideration the trend of sales, promotions and other parameters. However, though effective in some instances, this option may not be the most reliable if the retailer decides to change their assortment, add new products, change their provider, or make any other significant changes to the business from the previous year.
Another option is to change the light level for one store and during some period of time (week, month) gather data and then compare it with sales from other stores with the same assortments and format of department.
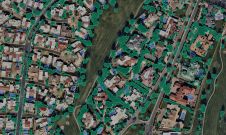
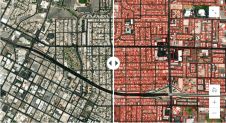
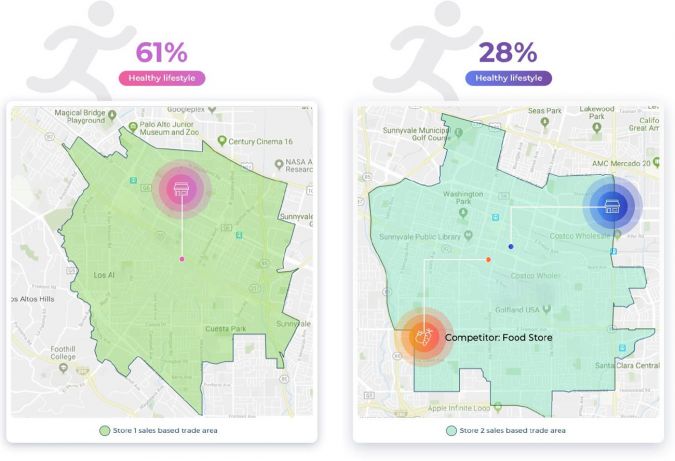
However, would it be correct to compare each store without having detailed insights on other competitors in their trade area? Well, Imagine that you have two stores in different locations. The first store (Figure 2a) is located in the area with 61% of the population living a healthy lifestyle and there are no competitors inside its trade area. As a large percentage of the population within this location lead a healthy lifestyle, it is very likely that sales percentages in the Fresh Produce or Organic Produce department of that store will be significantly higher.
In the second store (Figure 2b), we can see that only 28% of people within that area live a healthy lifestyle and there is a vegetable store right across the street. This means that the fresh produce department within that store is likely to have much lower fresh produce sales that the first store. Considering this, it wouldn't be correct to compare the influences of lighting near the Fresh produce department on buying behaviour among these stores.
The best solution in this case, then, will be to use light level data from sensors (IoT) on constant base, use geospatial data to define similar stores (store clusters) by different parameters like: real estate, trade area characteristics, demographic data, and a number of competitors and amplifiers. As a result, retailers define the best lighting for department, increase their sales, and save energy.
Conclusions and Recommendations
Ultimately, analyzing data from IoT sensors and geospatial data around the stores can have a real impact on retail bottom line sales levels by influencing consumers buying behaviour. By adopting this strategy, a retailer can identify key buying patterns that enable them to make actionable, performance-enhancing changes to their business by combining IoT, geospatial data and machine learning algorithms.
However, it is important to realize that analysing only part of these data points would lead to wrong conclusions. For example, though thermal comfort has a massive influence on human behaviour, in order to identify those persuasion points clearly, IoT sensors data and geospatial data must be analyzed together.
Geospatial analytics platform Fract has been working alongside leading IoT providers and combines all these parts together and helps retailers to develop a new type of smart store environment as a result, increases main retail KPIs and metrics. What’s unique about the Fract solution is that it allows stores to harness and measure the effect climate has on buyer behaviour both internally and externally. As discussed in this article, humans are highly influenced by the effects of climate - be it the temperature of their bodies or the levels of light that are absorbed through their eyes. Until now, these sensations have rarely been explored as potential tools of influence in the realm of retail, but now retailers can start to record this information and use what they find to improve the performance rate of their business on multiple levels.
By performing this analysis to identify dependencies of temperature, lighting, Co2 emissions, and humidity on human behaviour - the retailer is placed in a win-win situation where profit is the only outcome. How so? Because retail stores can use the information they find to, a) make changes to instore climate that help maximize consumer comfort, enhance product desirability, and improve buying behaviour, or b) make economic adjustments to utilities in store to drive down energy costs and ensure resources are being used as efficiently as possible.
References
- P Naveen kumar, P Kumaresan and Y Babu Sundaresan. (2017). IoT based retail automation of fuel station and alert system. IOP Conf. Ser.: Mater. Sci. Eng. 263 042072
- J Manyika. (2015). The Internet of things: Mapping the value beyond the hype. McKinsey Global Institute.
- Weber and R. Reinhard Schütte. (2019). A Domain-Oriented Analysis of the Impact of Machine Learning—The Case of Retailing. Big Data and Cognitive Computing 3(1): 11
- S. Chandel and R. K. Aggarwal. (2012). Thermal Comfort Temperature Standards for Cold Regions. Ashdin Publishing Innovative Energy Policies Vol 2.
- T. Amasuomo, J.O. Amasuomo. (2016). Perceived Thermal Discomfort and Stress Behaviours Affecting Students’ Learning in Lecture Theatres in the Humid Tropics. Buildings 2016, 6, 18.
- Modarres Nezhad, Majedeh. (2014). Evidence-based Strategies for Sustainable Lighting Design in Grocery Stores.
- Charles Areni, David Kim The influence of in-store lighting on consumers' examination of merchandise in a wine store. International Journal of Research in Marketing March 1994 11(2):117–125 DOI: 10.1016/0167-8116(94)90023-X
- Don Kropf. Meat Display Lighting. (2010). National Pork Board/ American Meat Science Association Fact Sheet.
Value staying current with geomatics?
Stay on the map with our expertly curated newsletters.
We provide educational insights, industry updates, and inspiring stories to help you learn, grow, and reach your full potential in your field. Don't miss out - subscribe today and ensure you're always informed, educated, and inspired.
Choose your newsletter(s)