Visual Crossing Unveils Maps for Microsoft Excel
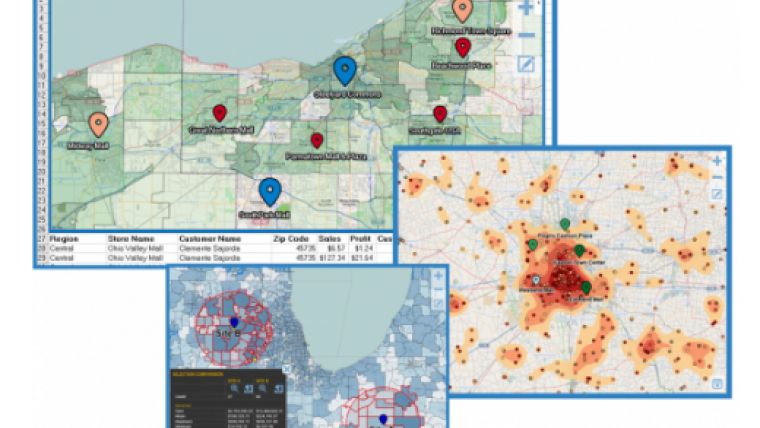
Visual Crossing Corporation has released its mapping software add-on for Microsoft Excel. It empowers spreadsheet users to bring presentation-quality maps and geospatial analysis to their own Excel data whether for business, education, or personal use. The visualization, performance, and analytical capabilities are used by Fortune 500 and global enterprises to add geospatial analysis to business data on sophisticated analytics platforms such as MicroStrategy and SAP.
“Visual Crossing’s high performance is essential in our ability to successfully deliver powerful mapping to our users. It’s the only tool that can achieve the performance required to visualize and analyze our large datasets,” said Zoltán Bánkuti, CEO of BiXPERT. Additional features include completely customizable map formatting, flexible labelling functionality, dynamic visual data sequences, and advanced selection and analysis capability. Users can not only make presentation-quality maps, but they can also do interactive data analysis directly within the map itself.
Geospatial analysis for everyone
At less than $2 per month, the new product is well within the reach of every Excel user. Millions of people use Excel for data analysis every day, and now these users have access to the same industrial-strength mapping technology for which enterprise businesses have relied on for more than a decade.
“Our goal is to give Excel users the same mapping technology enjoyed by users of expensive BI software such as SAP and MicroStrategy. These power-users have the tools to realize the geographic power hidden within their data. We wanted to make those tools affordable, flexible, and easy-to-use, so that every spreadsheet user could benefit,” said Sam Helwig, Director of Engineering for Visual Crossing.
More powerful than Power Map
Many Excel users start their data mapping experience with Microsoft’s built-in mapping tool, Power Map. However, the limited functionality and lack of flexibility that Power Map provides often leaves users wanting more. Visual Crossing brings functionality such as advanced selections, formatting, and labelling that Power Map doesn’t provide.
In addition, Visual Crossing is fully embeddable within any Excel worksheet. This allows the easy creation of custom dashboards and presentation workflows where grids, graphs, and maps coexist in one interactive document. Any user can open an Excel file with an existing map and immediately benefit from the saved visualization or begin additional geospatial analysis.
Harnessing cloud-base mapping
Using the power of cloud-based servers the add-on avoids the costly and complex process of managing geospatial data and setting up dedicated server hardware. Instead, the map server technology is hosted in the cloud making it always available yet unseen by the end-user. The only component installed on the Excel user’s machine is a small add-in available from the Microsoft Office Store. For business users or others who have additional security requirements or need custom data, Visual Crossing is available both as a custom, cloud-hosted solution as well as a package that can be installed on-premises.
For more information about Visual Crossing for Microsoft Excel visit http://www.visualcrossing.com/excel. A free trial of the add-in is available after which the cost is $1.49 per month (or local currency equivalent). Multiuser and enterprise licenses are also available.

Value staying current with geomatics?
Stay on the map with our expertly curated newsletters.
We provide educational insights, industry updates, and inspiring stories to help you learn, grow, and reach your full potential in your field. Don't miss out - subscribe today and ensure you're always informed, educated, and inspired.
Choose your newsletter(s)