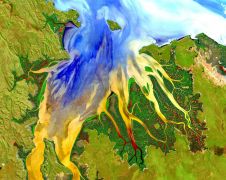
EcoSystem Survey Data Mapping Interface
Web-based GIS Application for Ocean Species Sample Analysis
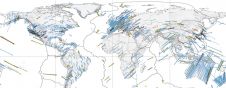
Data on ocean species has been being sampled along US coastlines for some sixty years. To enable scientists requiring such data for a variety of investigations to retrieve it and create dynamic spatial distribution GIS maps, the authors developed a Web-based application, the EcoSystem Survey Data Mapping Interface, which allows easy creation of dynamic GIS maps and interaction with them using GIS tools.
The ESDMI application consists of a three-tier architecture built around open source tools: Mapserver as GIS map rendering engine and Perl script as the main programming language. The Apache HTTP Server has been chosen as Web-application server engine and Oracle 9.2 as backend database. The three-tier architecture consists of the Client side, the Server side and the Database component.
From Query to Map
From the client side users make queries which are next submitted to the server. After having received the query the server creates an SQL statement, which is sent to the Oracle database. After receiving the query results from the database engine, Mapscript builds a point-type GIS layer representing all the survey stations of species sample data. Then Mapserver reads this station layer and other background layers, such as coastline and bathymetry, and converts them into a JPG format final map, sending it to the client side for use by the scientist. Users can further explore the map and data using GIS functions such as zoom, pan, query, help, and whole extent map. Once users make these adjustments the new map parameters will be sent to the server again, where new maps are generated and sent back to the user.
Event and Controller
The needs of scientists regarding the type of information to be retrieved may differ. The required flexibility is achieved by using the Model-View-Controller (MVC) design pattern as programming architecture; to date only the map view has been implemented. With MVC, the core data model functionality is separated from the map presentation and the control interface logic that uses this functionality. This allows multiple views to share the same core data model and makes supporting multiple clients easier to implement, test and maintain. An event is an action carried out by the user on the Controller page or the View page of the system. For example, with a mouse-click, map parameter is selected on the Controller page. On the View page the user may click any of the GIS function buttons.
The Controller page interprets mouse and keyboard inputs from the user, commanding the model and/or the view. The application uses one Controller page where the user can make selections, which are submitted to the server side. Users may choose from five selection options:
- Species Name: the database contains 714 different species Start Year: any year from 1963 (start of collection of species samples) to present
- End Year: any year from 1963 to present, but should be larger than start year
- Season: three bottom trawl survey seasons are normal: Spring, Summer and Autumn
- Metric to be Mapped (Catch number or Catch Weight per tow).
Map View and Model
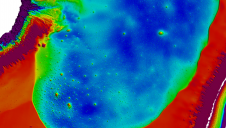
The map frame, to which the present design is limited, shows on the left the result category - catch weight or catch number per tow grouped into classes; the larger the size of the circle the higher catch weight or number. Using the layer toggle on/off tool beneath the legend, users can turn on/off background layers by selecting/ unselecting the layer name. The map reference part beneath the layer toggle part shows the whole map extent, and the red-highlighted rectangle shows the currently active map view. Buttons to activate GIS functions tools are at the top of the frame. The functions include zoom, pan, query, help, and whole extent map. The print button enables production of a print of the map.
Model manages the process rules and data of the application domain, responds to instructions to change state (from the users’ selections on the controller page), and responds to the requests for information about its state (from the view). A set of Perl scripts and Mapscripts work as model. After receipt of user query parameters, the following actions are carried out:
- extract query information from user’s query parameters
- create from que-ry information SQL statement
- retrieve species sample survey data from Oracle database
- build point-type GIS layer for the caught species based on individual stations by Mapscripts
- generate JPG format GIS map from new station layer and other background layers, such as coastlines and bathymetry, from spatial database by Mapserver
- send map view to the client side.
Concluding Remarks
ESDMI is hosted on the Northeast Fishery Service Center of Massachusetts, which can be accessed at https://fish.nefsc.noaa.gov/cgibin/eco_survey/index.pl. The source code and interface frame can be downloaded to a personal computer or redistributed.
Acknowledgements
Thanks are due to colleagues Russell Brown, Joan Palmer, Nancy McHugh, Kathy Mays, and Jim Manning and to David Hiltz. The open source development group provided the Mapserver and technical support.
Further Reading
- Honglei Dai, Wenbao LIU, Lansen Chen. An Approach on Rendering GIS Vector Maps onto Internet. In: TSU GIS 2004-The 1st Annual GIS Symposium at TSU. May 19-20, 2004. Troy, Alabama USA.
- George Jeff (2002). SVG and GIS. Accessed May 7th 2002. www.directionsmag.com?article.php?article_id=198.
- Plewe, B. (1997). GIS Online: Information Retrieval, Mapping, and the Internet. Santa Fe, NM: OnWord Press, p311.
Value staying current with geomatics?
Stay on the map with our expertly curated newsletters.
We provide educational insights, industry updates, and inspiring stories to help you learn, grow, and reach your full potential in your field. Don't miss out - subscribe today and ensure you're always informed, educated, and inspired.
Choose your newsletter(s)