Shallow seabed mapping based on airborne Lidar bathymetry
Understanding and assessing the suitability of ALB for automatic seafloor mapping
This article presents a novel methodological approach to understand and assess the suitability of airborne Lidar bathymetry for the automatic classification and mapping of the seabed. This solution allows recording of the depth below the Secchi disk.
Airborne Lidar bathymetry (ALB) is a modern measurement technology for obtaining rapid depth measurements in shallow underwater environments. The technique allows recording of the depth below the Secchi disk. ALB datasets are suitable for nearshore coastal mapping purposes, including the determination of submerged morphological bedforms and coastal protection structures. This article presents a novel methodological approach to understand and assess the suitability of ALB for the automatic classification and mapping of the seabed.
Human expansion into coastal areas and their intensive use for economic and recreational purposes require information on their state, evolution and functioning. Effective management of the coastal zone, making full use of its resources while ensuring the safety of people living in it, makes it crucial to monitor and map this zone, which is challenging from a technical and logistical point of view.
Shallow coastal mapping
Coastal mapping is one of the fundamental tools supporting coastal engineering. It is an important element in monitoring and assessing the condition of the shore and the coast and makes it possible to identify the areas that are most sensitive to erosion. Therefore, it enables the effective and economical management of coastal protection. In the case of protected shores, surveying makes it possible to verify the functionality and efficiency of the reinforcement applied, which further contributes to the improvement of engineering practice.
Bathymetric Lidar measurements can provide capability for the measurement of shallow coastal areas. Compared to acoustic systems, they allow for much faster surveys in shallow areas at a lower cost. A bathymetric laser scanner uses a green (532nm) beam to register the depth below the water surface. Compared to topographic scanners, this is characterized by higher power and lower laser pulse frequencies, due to the longer return time of the reflected echo beam.
The identification and classification of seabed geomorphology from remote sensing datasets can be performed manually, automatically or semi-automatically. Manual mapping is laborious and time-consuming and requires expertise by preferably one interpreter. Therefore, this study proposes a method for automatic mapping of the shallow seafloor based on ALB datasets for the Southern Baltic.
Study sites and acquired datasets
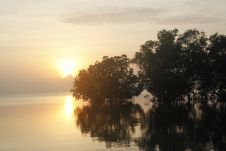
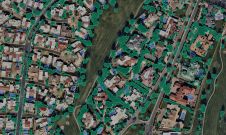
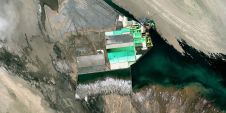
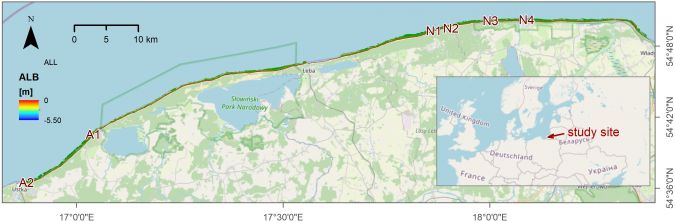
The study area was located on the Polish coast of the Southern Baltic (Fig. 1). Six polygons along the coast were selected for the study, representing strips of the seabed extending from the shoreline to a depth of about 5.5m. Four of these areas have a natural environmental character and two (near the towns of Rowy and Ustka) have been anthropogenically modified. The developed processing methods were also applied to a 48km shoreline section of the Southern Baltic.
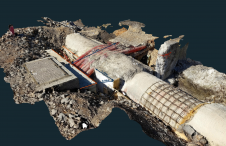
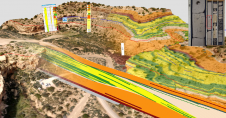
The study used ALB data from the Maritime Office in Gdynia (https://www.umgdy.gov.pl/) via the SIPAM portal (https://sipam.gov.pl/). The data were in the form of bathymetry digital elevation models (DEMs), created using a registered point cloud in the .las data format. The measurements were obtained by OPEGIEKA with the following specifications: minimum average scanning density of 2x12.4 points/m², average point horizontal error (XY) of 0.02m and average point vertical error (H) not exceeding 0.07m. The resulting model in the form of a terrain model is presented in Figure 2.

Manual classification of the bedforms
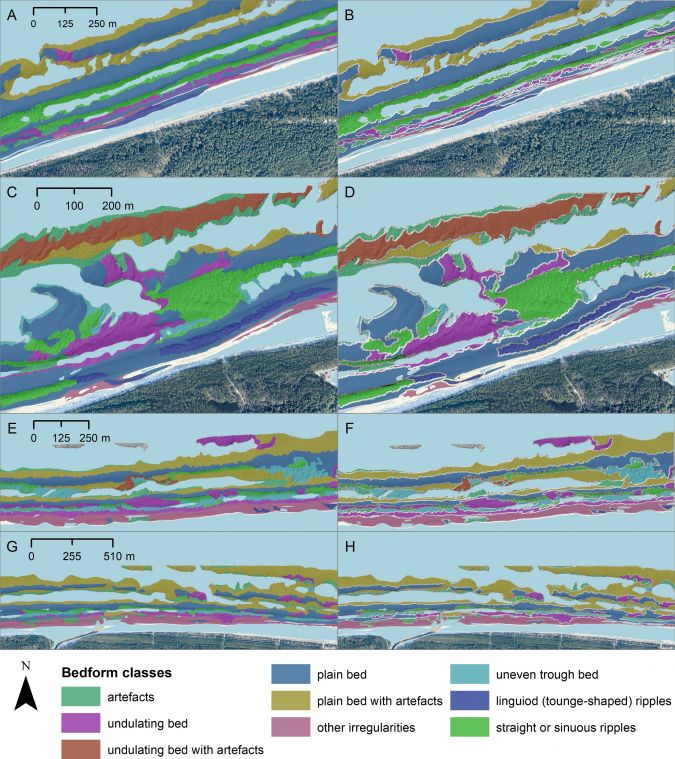
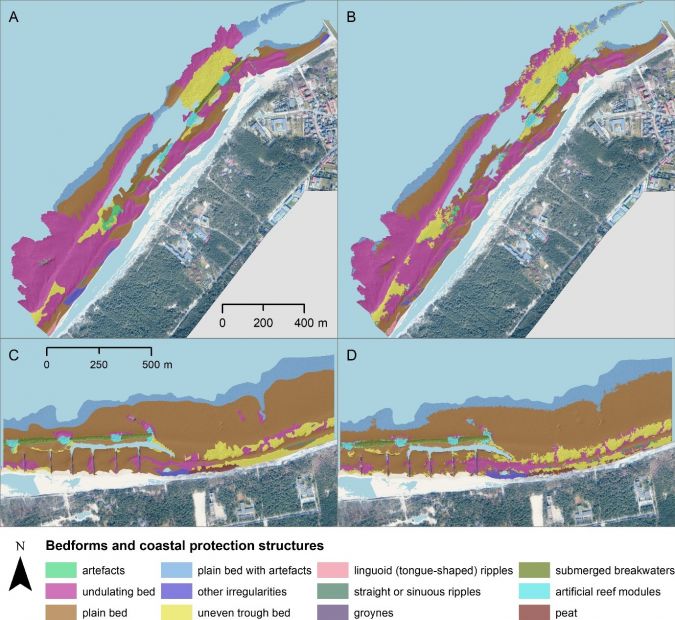
The spatial extents of nine types of bedforms and three types of anthropogenic structures were separated manually based on interpretation and analysis of the ALB by qualified geomorphologists. The analysis was supported by additional investigations of the seafloor relief and interpretation of depth, slope and aspect (including delineation of edges, slope bases, bedform ridges and trough form axes). Thus, 13 classes of objects were distinguished: artefacts, undulating bed, undulating bed with artefacts, plain bed, plain bed with artefacts, other irregularities, uneven trough bed, linguoid (tongue-shaped) ripples, straight or sinuous ripples, groynes, submerged breakwaters, artificial reef modules and peat.
Automatic processing of the ALB datasets
The ALB bathymetry allowed the extraction of a total of 21 attributes, such as slope, aspect, rugosity and curvature, plus more advanced attributes such as geomorphons or multi-resolution ridge top flatness (MrRTF). These were subjected to a feature selection algorithm whose results were further used for classification.
Ground-truth control points were generated based on manual classifications and a random process. They were separated for training and test samples and used as input for supervised classifiers. Automatic delineation and classification of the bedforms were carried out using geographic object-based image analysis (GEOBIA). This allows the segmentation of the remote sensing images (useful for delineation of the coverage of structures) and classification based on previously generated ground-truth datasets. All algorithms may be used in a semi-automatic way, to reach objective results. This study tested several segmentation and classification algorithms and selected the ones with the best results. The performance of the classifiers was measured using typical statistics such as producer’s, user’s and overall accuracy.

Performance of proposed predictors and machine learning classifiers
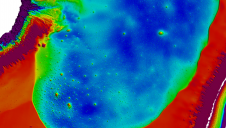
Analysis of the feature selection confirmed that all attributes were important for automatic classification, so all of them were used as inputs for the analysis. Initially developed for hydrology, MrRTF emerged as a good predictor for sandbar crests and tops of smaller bedforms such as megaripples, so was suggested as a potential diagnostic for the determination of such nearshore bedforms (Fig. 3).
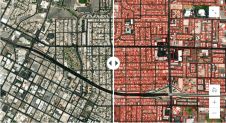
This study proved that the random forest (RF) classifier is appropriate for the precise automatic classification of bedforms and anthropogenic structures based on ALB measurements. RF had the highest performance of all the classifiers that were tested. Overall comparison of its results with manual classifications showed a good agreement for all major types of bedforms (Fig. 4). The same algorithm performed well in more complex areas with a mixture of natural bedforms and anthropogenic structures on the seabed (Fig. 5), as well as the 48km-long nearshore environment of the Southern Baltic. The accuracy in all scenarios varied between approximately 75% and 91%, with a median of 84%. An independent expert opinion showed that the resulting divisions are feasible and correct.
Will automatic classification replace manual interpretation?
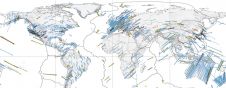
The presented research covers various aspects of determining and evaluating automatic mapping methods based on ALB datasets. Nine types of bedforms and three types of anthropogenic structures occurring in the nearshore zone of the Southern Baltic were distinguished, proving the suitability of high-resolution ALB datasets for automatic mapping of the nearshore zone. The extraction of the MrRTF can be efficiently applied to the automatic delineation of sandbar crest courses, which are of high importance for coastal protection. Spatial coverage of the ALB presented in this study shows that there is still a potential for improvement in the precision and penetration range of bathymetric laser scanner measurements. Although many geomorphometric attributes were tested, secondary features from other sources or at other spatial scales may improve the classification performance. Therefore, while there is still room for progress, significant advances have been made in the field.
Further reading
Janowski, L., Wroblewski, R., Rucinska, M., Kubowicz-Grajewska, A., & Tysiac, P. (2022). Automatic classification and mapping of the seabed using airborne Lidar bathymetry. Engineering Geology, 301, 106615. doi: https://doi.org/10.1016/j.enggeo.2022.106615
This research was funded in whole by the National Science Centre, Poland [Grant number: 2021/40/C/ST10/00240]

Value staying current with geomatics?
Stay on the map with our expertly curated newsletters.
We provide educational insights, industry updates, and inspiring stories to help you learn, grow, and reach your full potential in your field. Don't miss out - subscribe today and ensure you're always informed, educated, and inspired.
Choose your newsletter(s)