Using AI for good
Mapping sub-Saharan Africa to enable humanitarian aid
Humanitarian organizations turned to artificial intelligence (AI) to generate a comprehensive map of sub-Saharan Africa at scale and also keep it updated to reflect real-world changes.
Geospatial analysis is a crucial tool for both identifying communities in need and optimizing the distribution of resources. Humanitarian organizations seek to solve some of society’s most complex challenges but, until recently, humanitarian aid workers did not have a reliable source of geospatial data for sub-Saharan Africa. As a result, thousands of people in need were not being reached and the limited resources of nonprofits were not being leveraged efficiently. Thanks to collaboration among the world’s largest humanitarian aid organizations and geospatial data providers, there is now a comprehensive map of every building and road in sub-Saharan Africa. The map is supporting public health, education and sustainability initiatives.
Many people believe the world has already been mapped in its entirety. However, as many geospatial professionals know, despite decades of technological innovation in geographic information systems (GIS), the world is not mapped equitably. While some regions of the world are mapped in extensive detail, including rich context related to land cover or property attributes, others are not.
Developing more equitable maps
Unfortunately, this inequity in mapping tends to affect historically underserved regions the most. Humanitarian organizations have long been leveraging GIS for field planning and resource allocation, but often struggle with sourcing or creating comprehensive map data for these efforts. While organizations from every industry grapple with the time-consuming, resource-intensive process of manual digitization or data cleansing, the challenges of data creation and sourcing are particularly difficult for humanitarian aid organizations, which are typically nonprofits with limited resources. Not only are the resources available for these mapping efforts scarce, but they can also be wasted when inaccurate data is used for field planning. Most importantly, incomplete maps can have dire consequences for those communities not represented.
Underrepresentation of sub-Saharan Africa
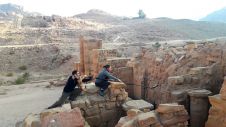
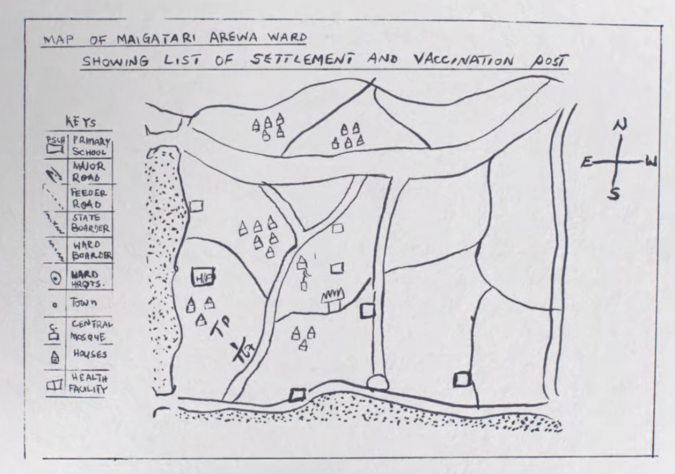
Sub-Saharan Africa is one region historically underrepresented in geospatial data. Until recently, humanitarian organizations active in the area relied on hand-drawn paper maps of settlements and road networks for field planning (Figure 1). Although these maps were better than nothing, humanitarian aid workers knew they were not reaching all communities in need. The paper maps were often outdated and based on approximate locations of settlements. As a result, field teams did not have sufficient information to plan optimal routes between sites or provide the correct amount of supplies.
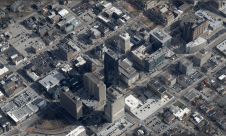
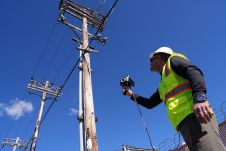
A group of humanitarian organizations, including the Bill & Melinda Gates Foundation, World Health Organization (WHO) and Centers for Disease Control (CDC), determined they required a reliable map of every building and road in sub-Saharan Africa to ensure they could reach and adequately serve every settlement in need. This data would allow field teams to locate all settlements in need, estimate the population in different settlements, allocate supplies accordingly and reduce carbon emissions and wasted time from sub-optimal routing between sites. However, geospatial experts estimated that it would take thousands of years to manually digitize the more than 416 million buildings and 17 million linear kilometres of roads in the region.
Mapping communities in need with AI
At first, this astronomical project scope made a comprehensive map of sub-Saharan Africa seem unattainable. Humanitarian organizations held ‘map-a-thons’ to crowdsource manual-digitization help from the international community, but found that even after hundreds of geographers digitized for multiple days, only about a million buildings had been mapped. More formalized mapping projects performed in-house by various humanitarian organizations resulted in buildings from just one country in the region being digitized after a year of work. Therefore, such manual mapping efforts were proven to be unscalable and unsustainable, especially considering the rapidly changing nature of the world in terms of population growth, migration and more. The humanitarian aid organizations realized the need for not only a map of every building and road, but also a way to keep that map up to date.
To generate a comprehensive map of sub-Saharan Africa at scale and also keep it updated to reflect real-world changes, humanitarian organizations turned to artificial intelligence (AI). Having heard about the Canadian mapping company Ecopia AI’s previous work digitizing every building in the USA and Australia in just six months, the organizations engaged the company to digitize every building and road throughout sub-Saharan Africa from imagery provided by Maxar.
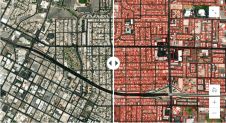
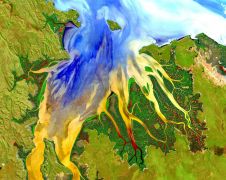
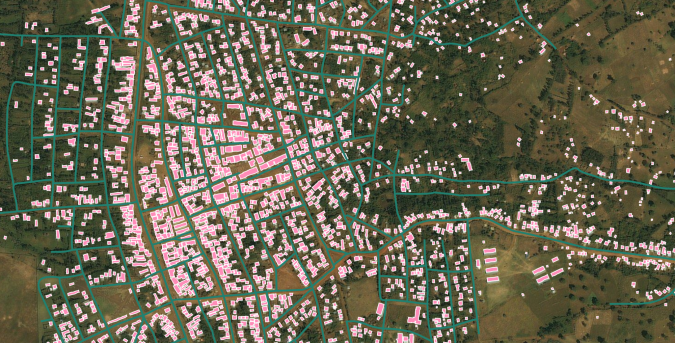
Through funding by the Bill & Melinda Gates Foundation and Sustainable Development Technologies Canada (SDTC), Ecopia was able to extract all 416 million buildings and 17 million linear kilometres of roads in just eight months (Figure 2). Because Ecopia’s AI-based mapping systems digitize features with the accuracy of a trained GIS professional, the resulting data serves as a digital source of truth for teams to leverage during field planning and resource allocation. Furthermore, data can be updated efficiently and frequently, meaning maps can reflect population and landscape changes that impact humanitarian operations.
Thanks to the comprehensive map, humanitarian aid organizations have identified thousands of people in settlements not previously represented in geospatial data, and are now providing lifesaving healthcare as well as other essential services to these chronically underserved populations. Additionally, field teams can now plan the most optimal routes between sites to reduce harmful carbon emissions and preserve scarce resources.
Saving lives and building a more sustainable future
To enable even more teams than those originally involved to leverage this unprecedented map of sub-Saharan Africa, Ecopia established the ‘Digitize Africa’ programme. Since creating Digitize Africa, Ecopia has provided the data to a wide range of global nonprofits for public health, education and green infrastructure projects. For example, the WHO leverages Digitize Africa data for the distribution of bed nets to reduce cases of malaria, catchment analysis of Ebola spread, and site selection for snake-bite treatment centres. Many humanitarian organizations are similarly applying the data to improve public health in the region, including the Bill & Melinda Gates Foundation, Red Cross and CDC.
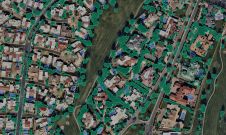
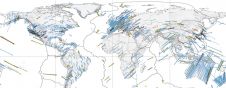
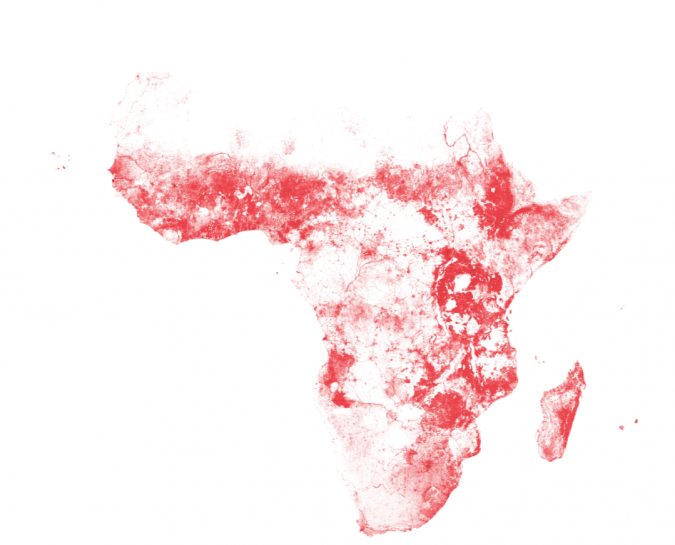
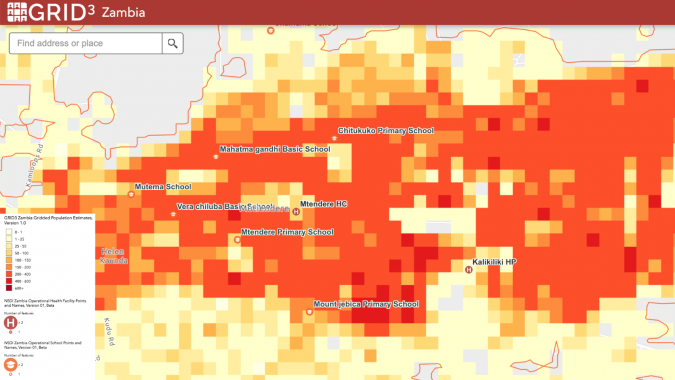
With a digital source of truth for buildings and roads in the region, humanitarian organizations can not only enhance their response efforts following a crisis, but can also help to mitigate future crises by predicting needs and planning field operations accordingly. Unlike settlement centroids, which are only helpful for generally locating a community, building footprints enable population estimations that inform demand forecasting and supply chain management. Additionally, building footprints help field teams locate even the most remote dwellings, rather than just those near a settlement centroid (Figure 3).
As teams continue to work with the Digitize Africa data, geospatial literacy is improving within both the humanitarian sector and the region as a whole. Organizations and individuals alike are recognizing the usefulness of GIS and geospatial data for a wide range of applications, and local teams are building important skillsets to continue advancing the operations on the ground.
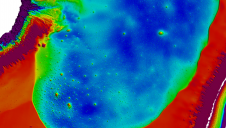
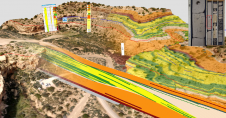
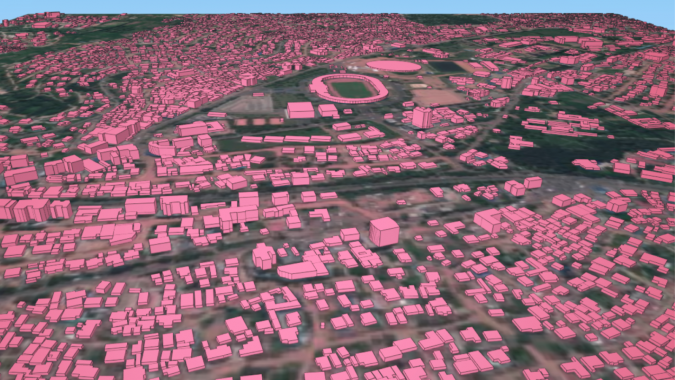
This improved geospatial literacy is driving continued innovation in the region. Moving forward, the numerous organizations involved in the Digitize Africa project are looking to expand the use of the data to build out green infrastructure in sub-Saharan Africa by identifying suitable sites for solar panel installation and other renewable energy sources. Similarly, recent advancements in 3D mapping are improving population estimation models for important initiatives related to education and public health (Figures 4 and 5).
Conclusion
Despite sub-Saharan Africa’s historical underrepresentation in geospatial data, humanitarian aid organizations now have a digital source of truth for planning lifesaving field operations. Thanks to AI-based mapping systems and a network of global partner organizations, the Digitize Africa project provides a comprehensive, accurate and up-to-date map of every building and road in the region. With this critical foundational data, these organizations are making a real difference in people’s lives through public health, education and sustainability initiatives, while also improving geospatial literacy and driving innovation in sub-Saharan Africa.
Value staying current with geomatics?
Stay on the map with our expertly curated newsletters.
We provide educational insights, industry updates, and inspiring stories to help you learn, grow, and reach your full potential in your field. Don't miss out - subscribe today and ensure you're always informed, educated, and inspired.
Choose your newsletter(s)