Esri Story Map Shows US Infrastructure Needs Serious Work
The American Society of Civil Engineers (ASCE) has released its 2017 Infrastructure Report Card, giving the United States a D+ grade. Mapping company Esri has created a Story Map to help put the infrastructure issues into context.
The Esri Story Map “A Network Derailed” presents a comprehensive overview and analysis of all major transportation infrastructure systems and networks, including highways, bridges, railroads, ports, waterways and airports. Using interactive maps, users can pan and zoom to areas of interest.
The latest authoritative data is incorporated, including the ASCE report card and the 2016 National Bridge Inventory released in earlier this year. The story also cites the latest figures from the Congressional Budget Office (CBO), Congress and the Trump administration.
Some interesting facts:
- In 2016, 47% of urban interstate vehicle miles travelled were over structurally deficient pavement.
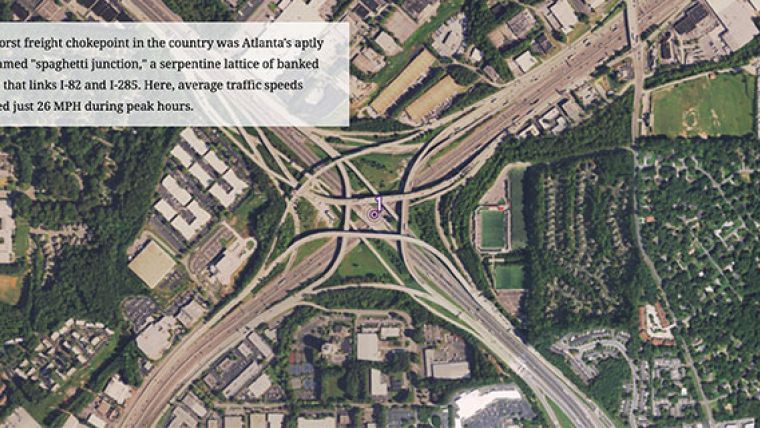
- The 10 worst trucking chokepoints for 2016 are displayed on the map (Atlanta, New York, and Chicago).
- Bridges are scaled according to truck traffic and coloured according to their structural status. Individual bridges are indicated.
- Viewing rail bridges illuminates the fragility of the transportation system — one untimely bridge collapse could bring the regional rail system to a halt with few alternative routes.
- The 50 busiest airports in the U.S. by total cargo landed can be viewed.
Value staying current with geomatics?
Stay on the map with our expertly curated newsletters.
We provide educational insights, industry updates, and inspiring stories to help you learn, grow, and reach your full potential in your field. Don't miss out - subscribe today and ensure you're always informed, educated, and inspired.
Choose your newsletter(s)